The Case
The thesis is one claim, testable: firmed 24×7 power delivered on-site from an inland corridor costs 30–60% less than firmed 24×7 coastal supply, for workloads that can consume power where it is generated. This page defends the claim, sizes the fit, and cites the precedents that either support or challenge it.
The Cost Ladder
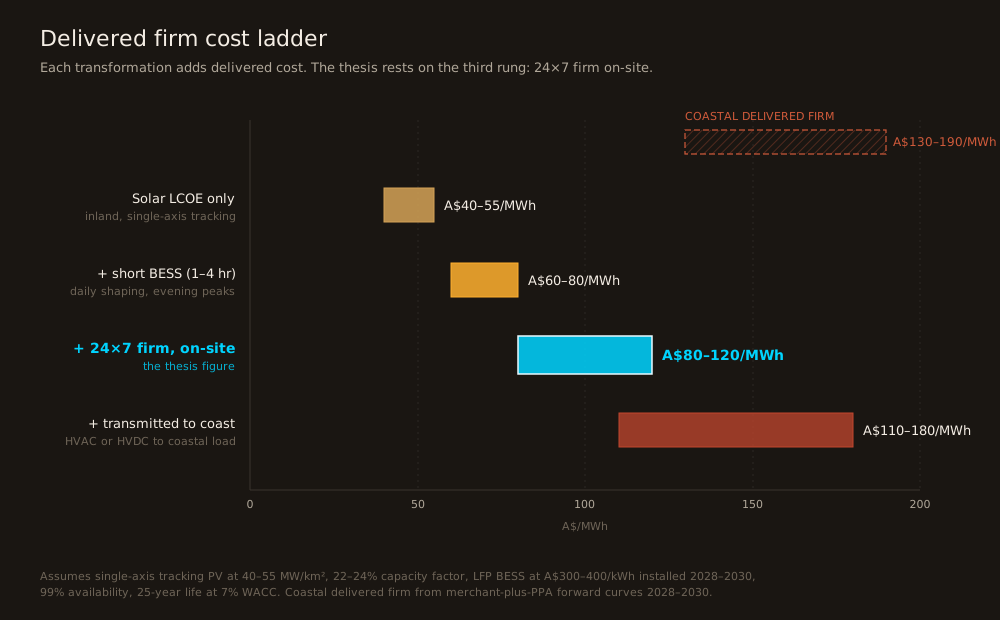
Four figures matter. The ladder shows how each transformation adds delivered cost.
| Transformation | A$/MWh | What It Buys |
|---|---|---|
| Solar LCOE only | 40–55 | Inland, single-axis tracking. Not firm. |
| + short-duration BESS (1–4 hr) | 60–80 | Daytime and evening loads. Not continuous industrial firming. |
| + 24×7 firm to 99% availability, on-site | 80–120 | The load the corridor is built for. |
| + transmitted to coast | 110–180 | Uneconomic against coastal delivered firm. |
Solar LCOE (inland, single-axis tracking). Consensus range A$40–55/MWh. Depends on capex per MW (A$0.9–1.2M at scale), capacity factor (22–24% inland), and financing (debt/equity mix, WACC 6–8% for institutional infra).
Solar + short-duration BESS (1–4 hr). A$60–80/MWh. Sufficient for daytime and evening loads, not for continuous industrial firming.
Solar + BESS, 24×7 firm to 99% availability. A$80–120/MWh. Storage-to-generation ratio is 6–10 GWh per GW installed — driven by winter dispatch, not annual energy. This is the load the corridor is built for.
Solar + BESS firmed + transmitted to coast. A$110–180/MWh. Long-distance HVAC or HVDC adds A$10–30/MWh in transmission losses and capex recovery. The corridor is uneconomic for coastal load at this level.
Comparison point. Delivered firm power to a Sydney or Melbourne data centre in 2028–2030, on a merchant-plus-PPA basis, sits at A$130–190/MWh under current forward curves. The corridor’s on-site number (A$80–120/MWh) sits materially below that. The corridor’s transmitted-to-coast number (A$110–180/MWh) overlaps and does not clear it. That is the entire thesis, priced.
The Workload Fit
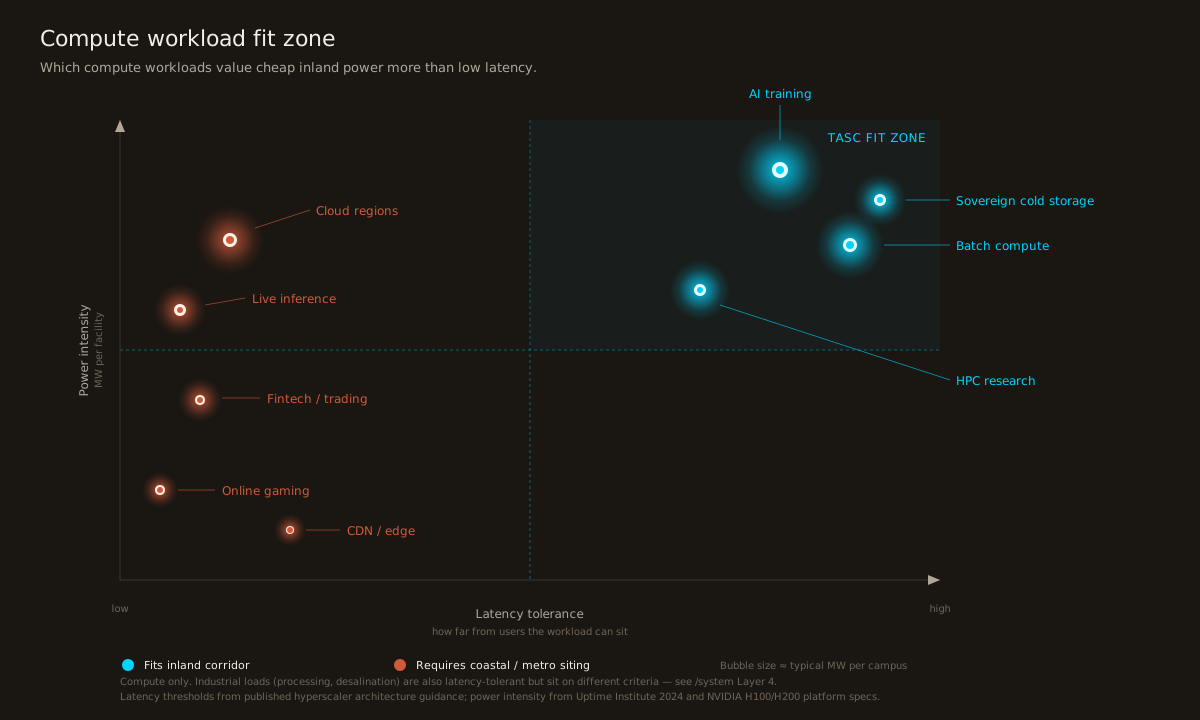
Compute and processing workloads sort on two axes: latency tolerance (how far from users they can sit) and power intensity (MW per rack, in the compute case; MWh per tonne, in the processing case). The corridor’s cost advantage matters only in the upper-right quadrant.
Fits the corridor:
- AI training (foundation models, fine-tuning). 40–200 MW per campus. Tolerant of 50–100 ms RTT.
- Batch compute (rendering, simulation, backup indexing). Tolerant of asynchronous scheduling.
- Sovereign cold storage. Latency-tolerant by definition.
- HPC research (weather, genomics, materials). Batch-scheduled.
- Crypto mining. Not a policy priority, mentioned for completeness.
Does not fit the corridor:
- Cloud regions serving consumer traffic (Sydney and Melbourne exist for a reason)
- Live AI inference to users
- Online gaming, fintech, high-frequency trading, CDN edge
- Anything requiring <10 ms RTT to eastern-seaboard populations
- Light manufacturing, assembly, or logistics-flow-bound industry
Industrial loads that fit the corridor:
- Critical minerals refining
- Refined alumina
- Battery precursors
- RO desalination at industrial scale
- Magnesium
- Urea
These qualify on energy share of operating cost rather than on latency, which is why they sit outside the scatter above. See System Layer 4 for the screen and the exclusions.
Hyperscalers already stratify their infrastructure this way — training regions and inference regions are separate campuses in separate places. The corridor plays for the training side of that split.
Precedent
The corridor is not without reference points. Six projects, actively delivered or under construction, calibrate what has and hasn’t worked at inland-Australian scale.
| Project | Scale | Announced Capex | Status (Q3 2026) | What It Tells Us |
|---|---|---|---|---|
| Sun Cable / AAPowerLink | ~6 GW solar, HVDC to Singapore | ~A$30B+ | Reactivated under Squadron/Cannon-Brookes ownership; submarine cable approvals continuing | Inland solar at multi-GW scale is fundable; the export cable is the binding constraint, not generation |
| Western Green Energy Hub | ~50 GW solar + wind, WA Goldfields | Not costed | Approvals and design phase | Demonstrates the resource case at continental scale; consent and offtake unresolved |
| Asian Renewable Energy Hub | ~26 GW solar + wind, Pilbara | ~A$36B+ | Federal environmental rejection 2021; restructured at smaller scale | Risk: an “all of it” pitch invites an “all of it” rejection |
| CopperString 2.0 | 1,100 km HVAC, 330 kV, Townsville–Mt Isa | ~A$5B (federal co-funded) | Under construction; energisation ~2029 | Eastern grid anchor for the corridor; precedent for federal co-funding of enabling transmission |
| Snowy 2.0 | 2,200 MW pumped hydro | A$12B+ (over budget) | Construction; commissioning delayed | Warning: long-build infrastructure drifts on cost and schedule |
| Project EnergyConnect | ~900 km HVAC, NSW–SA interconnect | ~A$2.3B | Energising 2026 | Precedent for long-distance transmission delivery on-time and on-budget |
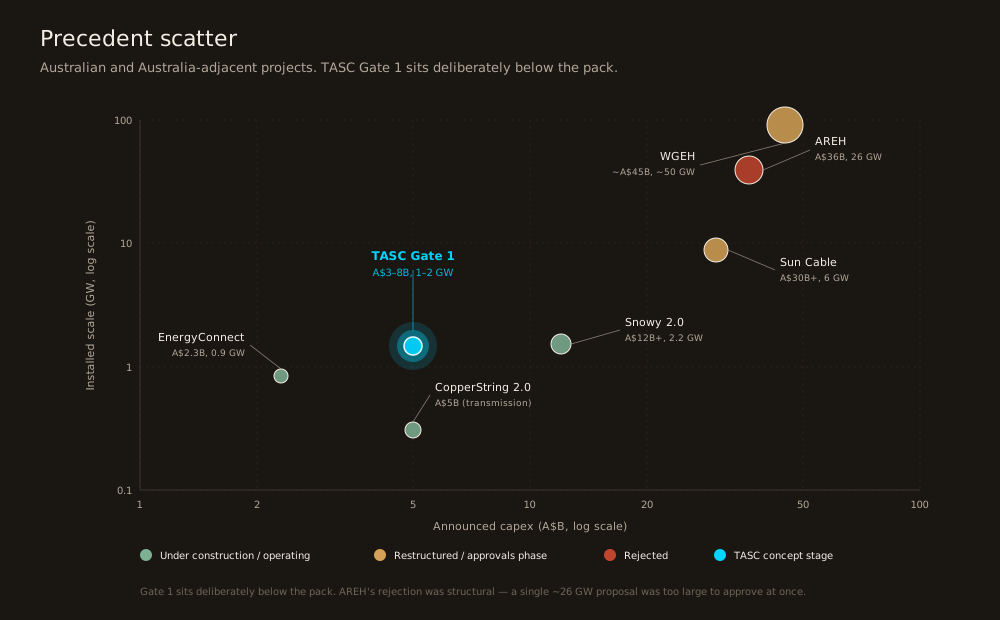
Two structural lessons.
Sun Cable’s difficulty was not the generation — it was the export cable. That validates the corridor’s core siting logic: consume the electrons where they are produced.
AREH’s rejection was structural. A single ~26 GW proposal presented to Commonwealth approval processes as one event was too large to approve. The corridor’s staging is deliberate on that basis — Gate 1 is a single node at ~1–2 GW, not a continent-spanning system.
Scale, Honestly Stated
The full-build envelope is meaningful for planning, not for pitching.
Base-case full build: ~120 GW installed solar across the corridor, ~231 TWh/year, ~26.4 GW continuous output.
For context, the NEM and WEM combined produced ~284 TWh in 2024. The corridor at full build is a system of comparable scale to the national grid.
But: full build assumes 25–30 years of successful staging past Gate 4. The site defends 1–3 GW at Gate 1 (2028–2032) and 6–15 GW at Gate 2 (2033–2038). Everything beyond that is conditional on the first two gates working.